I enjoy exploring how data can tell stories. Building interactive visualizations let me dig into topics I care about from social questions to personal interests and share them in a way that others can explore, too.
Here’s a look at a few of my recent visualizations.
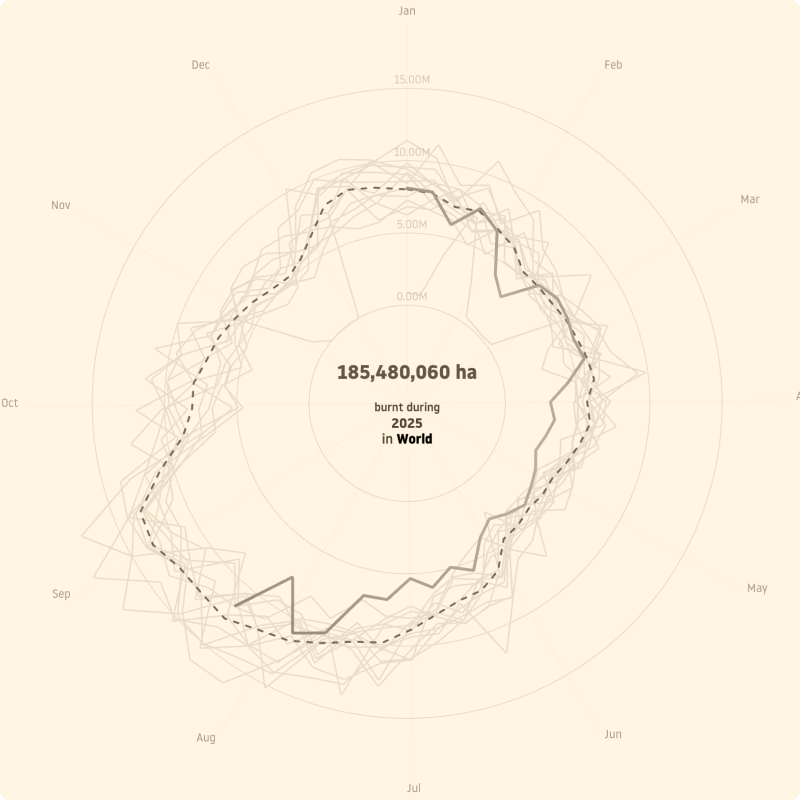
When the World Burns
August 2025
Discover the area burned by country by week since 2012
More visualizations are coming soon.